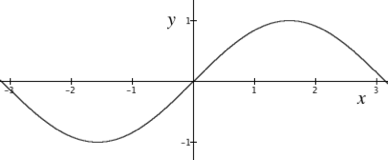
Figure 2.1.1. Graph of $y=\sin(x)$
| < Previous Section | Home | Next Section > |

You might see the graph of $y = \sin(x)$ as just a shape. But the graph actually represents the behavior of variations along a circle. To see this we must explore the meanings of y and x in the statement $y = \sin(x)$.
The following sections explore the meanings of x and y in $y=\sin(x)$, $y=\cos(x)$, and $y=\tan(x)$.
| < Previous Section | Home | Next Section > |