This section assumes that you have learned about radian angle measure. Review Chapter
2 if you are unfamiliar with radian angle measure.
A two-dimensional coordinate system is a method for locating points in the plane. It is also a method for representing the values of two quantities simultaneously. It was by Descartes’ ingenious method of representing the location of points in a plane or in space that we can visually represent relationships between quantities’ values.
A rectangular coordinate systems is like a street map of Phoenix (an exceptionally flat city). Locations are determined by intersections of lines that are perpendicular to axes (see Section 3.9).
A polar system works like radar. A point’s location is recorded according to its distance from a reference
point and its angle from a reference
direction. The reference point is called the system’s pole and the ray from the pole in the reference direction is called the polar
axis.
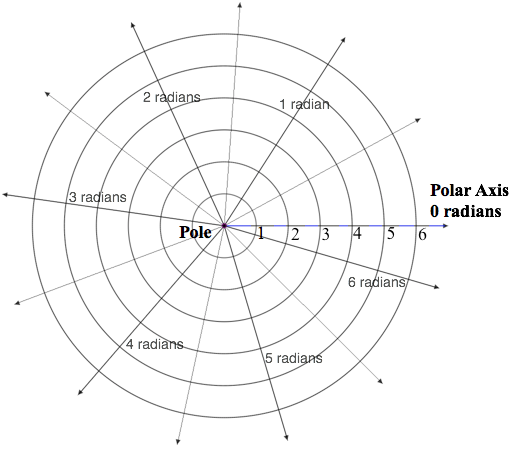
Polar Coordinate System
Figure 11.0.1 illustrates the polar coordinate system. Angles are measured in radians (see the Sections 2.2,
2.3, and 2.4). Distances from the pole are measured in units of the radius of the unit circle. Coordinates in the polar plane are customarily in the form (r, θ), where r is the point’s distance from the pole and θ is the measure in radians of the angle formed by a ray from the pole to the point and the reference direction. A point with coordinates (3, 1.2) in the polar system is 3 unit radius lengths from the pole in a direction of 1.2 radians from the polar axis.
Figure 11.0.1 The polar coordinate system. Rays point in directions,
measured in radians from the polar axis. Circles designate distances
from the pole, measured in units of the radius of the unit circle.
Coordinates of a point are given as (distance from pole, direction from
polar axis).
The animation in Figure 11.0.2 shows a way to think about determining a point’s location in the polar plane. First determine its distance from the pole. Once the distance is settled, determine the direction from the polar axis.
Figure 11.0.2. Locate a point in the polar
coordinate system by first determining its distance from the pole and
then determining its direction from the polar axis.
Some people find the convention for ordered pairs in polar coordinates to be unnatural. Though the first coordinate is r, it is sometimes easier to think first of a point’s direction. Imagine a ray pointing in the direction of θ, then imagine going r units in that direction (backing up if r is negative). Thinking of a point’s direction first also fits with the fact that θ often is taken as the independent variable when displaying a graph in polar coordinates. You are free to think of locating a point by any method you find most natural. Just remember that the order of the coordinates is (r, θ) when you represent a point in the polar plane.
Points in the polar plane do not have unique coordinates. Figure 11.0.3 shows a point in the polar plane located in two ways, both in the form (r, θ). The point in Figure 11.0.3 can be located by the pair (3.7 miles, 0.69 radians) and it can be located by the pair (‑3.7 miles, 0.69‑π radians).
Figure 11.0.3. Points in the polar plane
do not have unique coordinates.
Graphs in Polar Coordinates
To imagine a graph in the polar plane involves the same ways of thinking as imagining its graph in the rectangular plane. Imagine varying the independent variable a little bit at a time while simultaneously keeping track of the dependent variable’s value. Then record the covariation using the conventions of your coordinate system. In most situations in which we use polar coordinates, it is useful to treat θ as the independent variable and r as the dependent variable.
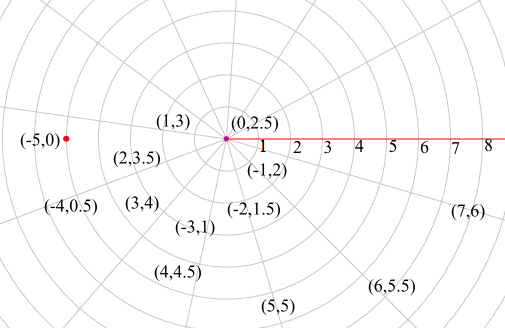
Imagine two quantities whose values are represented by r and θ, and that they have the relationship that r = 2θ – 5. To represent this relationship in the polar plane, vary the value of θ, keeping track of its value and the value of r. Recall that in the polar plane, θ is a number of radians measured from the reference direction and r is a number of unit lengths from the pole in the direction of θ. Figure 11.0.4 shows points with coordinates (r, θ) where r = 2θ ‑ 5. Be sure that you understand what the coordinates of each ordered pair represent and why these points are located where they are.
Figure 11.0.4. Points for r = 2θ - 5
plotted in the polar plane. They appear jumbled, making it hard to see a
pattern in their generation.
It is quite hard to envision the complete graph of r = 2θ - 5 in polar coordinates just from plotted points. The plotted points are too jumbled to convey what happens as θ varies. A complete graph of f in polar coordinates for 0 ≤ θ < 2π is given in Figure 11.0.5.
Imagine a ray, originating from the pole, being swept counter-clockwise as θ varies from 0 to 2π radians. At the same time that you sweep a ray from 0 to 2π radians, imagine the location at a distance of 2θ – 5 units in the direction that the ray points—going forward when 2θ – 5 is positive, and backward when 2θ – 5 is negative.
Figure 11.0.5. Graph of $r=2\theta-5$ as
$\theta$ varies from 0 to $2\pi$.
Exercise Set 11.0
For each of a-e, the coordinates on both sides of the equal sign are in the polar system. Fill in the blank so that the polar coordinates on the right locate the point represented by the polar coordinates on the left. Remember that polar coordinates are in the form $(r,\theta)$.
$(1, 2) = (-1,\_ \_)$
$(-3, \sqrt 2) = (3, \_ \_)$
$(3, -\pi/4) = ( \_ \_, 3\pi/4)$
$(4.3, 27) = (-4.3, \_ \_)$
$(-4.3, -27) = (4.3, \_ \_)$
Download and print four copies of this polar coordinate paper and four copies of this second polar coordinate paper.
Sketch a graph of each of (a)-(d) on both types of coordinate paper. Try not to plot individual points, but rather draw the graph smoothly while mentally estimating values of variables.
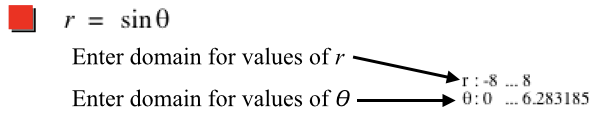
Check your sketched graph with GC. Type "theta" to get "$\theta$". Change the domains for r and $\theta$ in GC (shown below) as needed for each of (a)-(d). You must type numerical values for domain bounds. So, for example, enter 62.83185 for $10\pi$.
$r=0.1\theta,\, 0\le \theta \le 10\pi$
How far apart are two successive points that lie on the same ray from the pole?
$r=5-\theta,\, 0\le \theta \le 2\pi$
What are the coordinates of the point on the graph that is at the pole? How is it possible the graph never passes through $(0,0)$ even though it passes through the pole?
$r=\sin(\theta),\, 0\le \theta \le 2\pi$
Why does this graph make a circle? What is its center and radius?
$\theta=\sin(r),\, -8\le r \le 8$
This graph is called the Batman Curve.
Explain how the variation in $\theta$ relative to r over the following intervals produces pieces of the displayed graph. It might help to print a graph of $y=\sin(x),\, -8\le x \le 8$ in Cartesian coordinates. Then take x to be r and y to be $\theta$. Now sketch the graph of $\theta = \sin(r)$ in polar coordinates.
The animation below shows a machine gun rotating rapidly as it fires bullets.
Intervals of time between bullets fired are equal.
A bullet, once fired, travels at a constant speed in the direction it leaves the gun’s barrel.
The bullets seem to make a spiral. Do they? Hint: Consider that $dr/dt$ and $d\theta/dt$ are constant and neither is zero. Use this to say something about $dr/d\theta$.
Graphs of $r=m\theta$, m a non-zero real number, are called Archimedean Spirals.
Pause the movie. Do the bullets' positions lie on an Archimedean spiral? Explain.
Type the statement cos(0.8) into GC.
What does this tell you about a point on the graph of $y=\cos(x)$?
What does it tell you about a point on the graph of $r=\cos(\theta)$?